Introduction
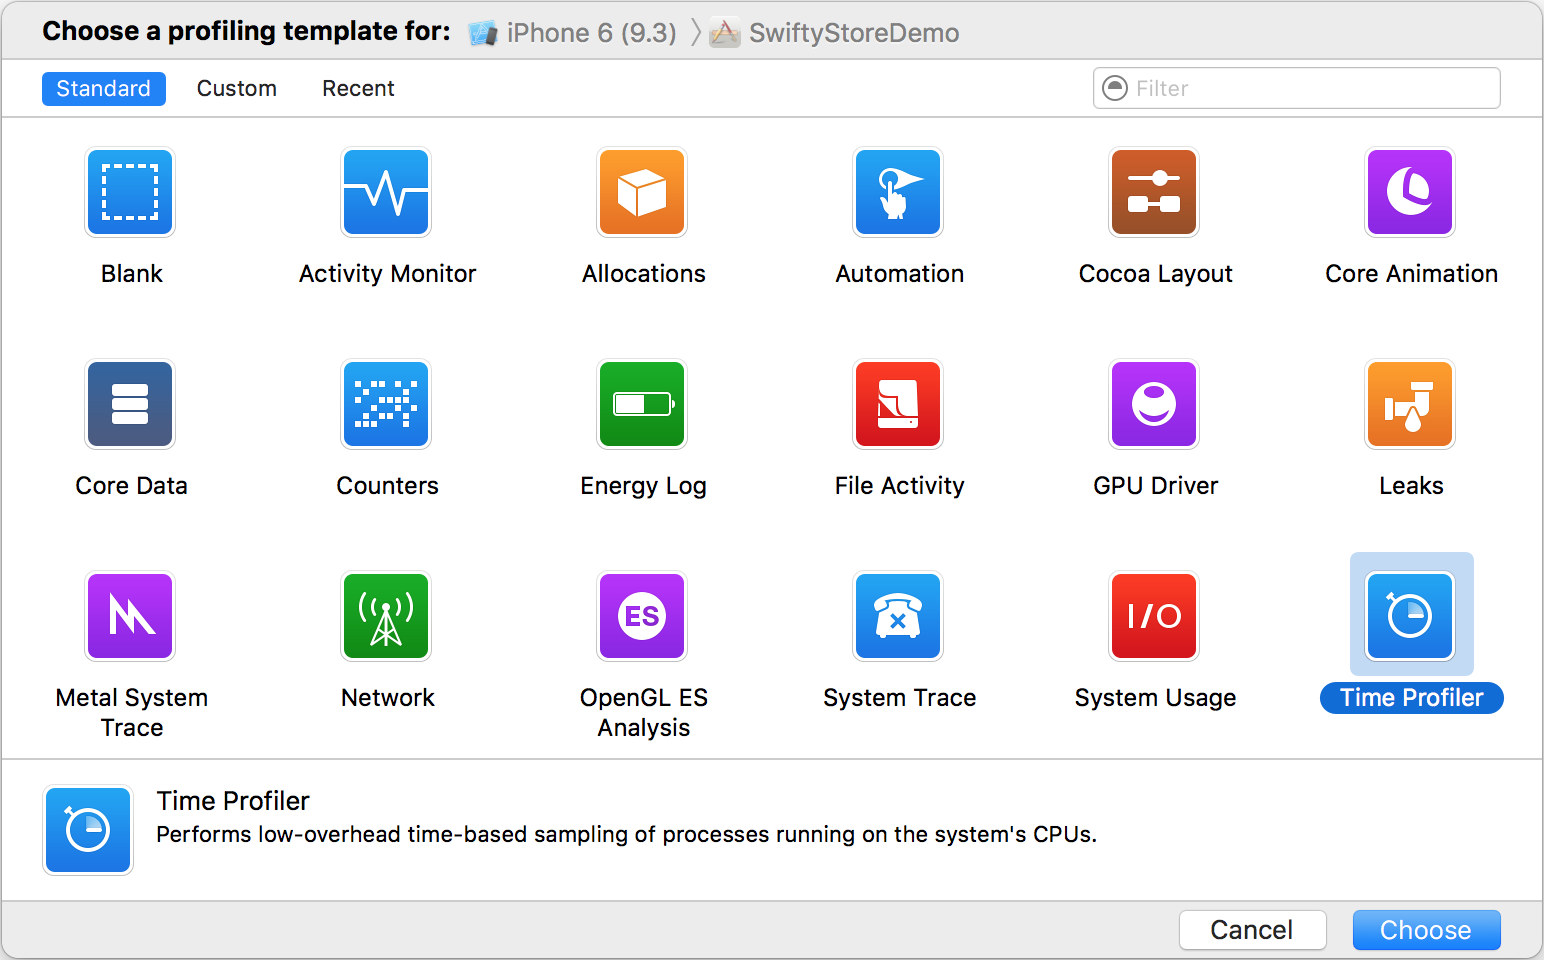
Xcode Instruments is a growing collection of tools to profile the runtime behaviour of your apps. In particular, the Time Profiler is a great tool to measure the performance of your code and analyse the running time of the various threads.
Every developer should get familiar with these tools. Read this and this for more details.
This blog post will show how to profile your app without using Instruments and highlight why this is sometimes preferable.
Profiling - without Instruments?
Quite often, we want a very direct way of measuring performance in known areas of our code. Check this out (all code snippets are in Swift 3.0):
let startDate = Date()

// Do some work

let elapsed = Date().timeIntervalSince(startDate)
print("Elapsed: \(elapsed) sec")
This is a simple snippet that I use frequently in my projects, because it is typically faster to run, measure, make a change and repeat when running the app than when running the profiler.
Note that we can use this approach if the time calculation is done all within a method body, as we can sample the startDate and endDate and calculate the difference in the same scope.
However, there are cases when this doesn’t apply.
Easy enough! Make it interesting
Recently I was running one of my apps and I noticed that it took a long time to perform a transition from a view controller to the next. In my specific case I was tapping on a cell and performing a segue to present a destination view controller.
In order to measure the time elapsed during this transition and improve its performance, I needed to establish where the startDate and endDate would be sampled:
- startDate: When a cell is tapped, the
didSelectItemAtIndexPathmethod is called. - endDate: When the
viewDidAppearmethod is called, the transition has completed and the destination view controller is visible on screen.
class ViewControllerA {
  func collectionView(_ collectionView: UICollectionView, didSelectItemAt indexPath: IndexPath) {
    // Measure startTime here
    let cell = collectionView.cellForItem(at: indexPath)
    performSegue(withIdentifier: "push", sender: cell)
  }
}
class ViewControllerB {
override func viewDidAppear(_ animated: Bool) {
super.viewDidAppear(animated)
// Measure endTime here
}
}As the two view controllers are separate and the viewDidAppear() method of ViewControllerB does not have access to the startTime value calculated in ViewControllerA, I decided to introduce a TimeIntervalEventTracker class with the following API:
class TimeIntervalEventTracker {
    class func trackStart(event: TimeIntervalEventType)
    class func trackEnd(event: TimeIntervalEventType)
}
With this design, the TimeIntervalEventTracker class can hold all necessary state (via a private singleton).
Additionally, I introduced the TimeIntervalEventType type, which is an enum defined like so:
enum TimeIntervalEventType: String {
    case albumsToAssetsTransition = "albumsToAssetsTransition" // push
    case assetsToAlbumsTransition = "assetsToAlbumsTransition" // pop

    case assetsToCarouselTransition = "assetsToCarouselTransition" // push
    case carouselToAssetsTransition = "carouselToAssetsTransition" // pop
}
This is so that I can define multiple events of interest. As long as both trackStart() and trackEnd() are called for a given event, the elapsed time will be printed, along with the name of that event.
This is a lot more flexible than the previous approach:
- Before: Could only measure time intervals within a method body
- Now: Can define all time interval events in a single place, and measure time between arbitrary code points.
Additionally, because all time tracking calls now happen via the TimeIntervalEventTracker class, we can customise the implementation as needed. Example:
- Only print time intervals that are greater than a given threshold.
- Use a custom formatted string in the
print()method. - Use log levels.
Implementation details
The full source code for the TimeIntervalEventTracker class is as follows:
class TimeIntervalEventTracker {

    static let printThreshold = 0.2

    var events: [TimeIntervalEventType : Date] = [:]

    static let shared = TimeIntervalEventTracker()

    class func trackStart(event: TimeIntervalEventType) {
        shared.events[event] = Date()
    }

    class func trackEnd(event: TimeIntervalEventType) {

        if let startDate = shared.events[event] {

            shared.events.removeValue(forKey: event)
            let elapsed = Date().timeIntervalSince(startDate)
            if elapsed > printTreshold {
                print("> time \(event.rawValue): \(elapsed) sec")
            }
        }
    }
}
This works by registering event with the associated startDate as a key-value pair in a dictionary. When the trackEnd() method is called:
- the correct
startDateis retrieved. - the entry for the given event is removed from the dictionary.
- the elapsed time is calculated, and printed if greater than
printThreshold.
Conclusion
This blog post presented a simple solution to measure the performance in known areas of our code. This strategy can be used as an alternative or in conjunction with the Xcode Time Profiler, as well as the measureBlock() API available in XCTest. In summary:
Advantages over Xcode Instruments
- Faster feedback loop.
- More targeted profiling (provided that we know exactly what we want to measure).
Disadvantages
- No call stack analysis and breakdown of time for each method.
- Requires instrumentation of code (may not want to check it in).
With the presented technique it’s possible to measure the time between any two events in the app. I have used this to speed up the transitions between view controllers in my Cast Player app by over 50%. I plan to write more in detail about this on a future blog post.
I hope that the material in this blog post can be useful for your projects - as it has been for mine.
Did you find this valuable? Have you ever encountered some tough app performance issues and how have you solved them? Let me know in the comments!
Reference
- Ray Wenderlich: Instruments Tutorial with Swift: Getting Started
- Medium post: What every iOS Developer should be doing with Instruments
- NSHipster post: XCTestCase / XCTestExpectation / measureBlock()
- Apple Docs: Time Profiler Instrument
- Apple Docs: XCTestCase
- Apple Docs: measureBlock()
Want to see your photos and videos on the big TV? Then Cast Player is the right app for you. Sign up to the mailing list to receive product updates. You can also get beta access with TestFlight.
If you liked this post, you can share it with your followers or follow me on Twitter!