In December 2016, I launched this free app:
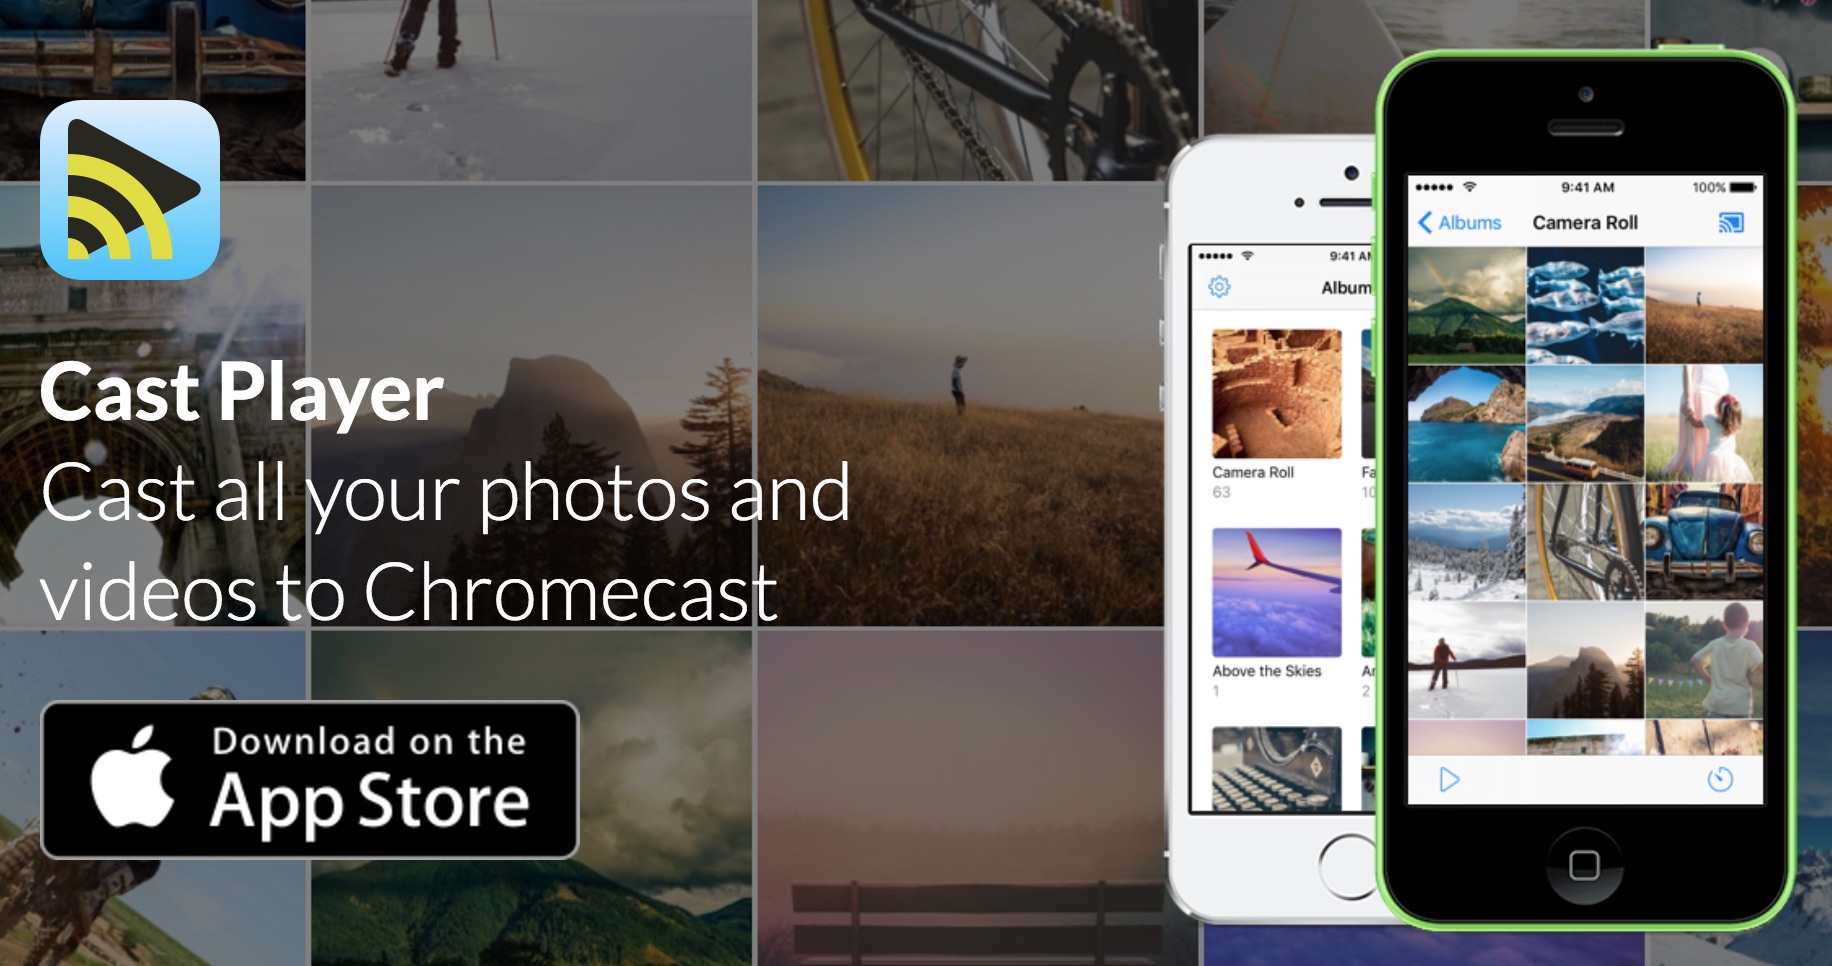
After trying to promote it on Hacker News and other outlets on launch day, I have mostly stopped marketing it. That is, apart from the occasional tweet:
Cast Player is now Live on the App Store! Free download, get it while it's hot! 🌶🌶 https://t.co/zfWPOeKGLU
— Andrea Bizzotto (@biz84) December 2, 2016
Here I analyse how the app has been doing, one month later. All numbers are from Fabric and AppAnnie as of January 6, 2017.
Overview
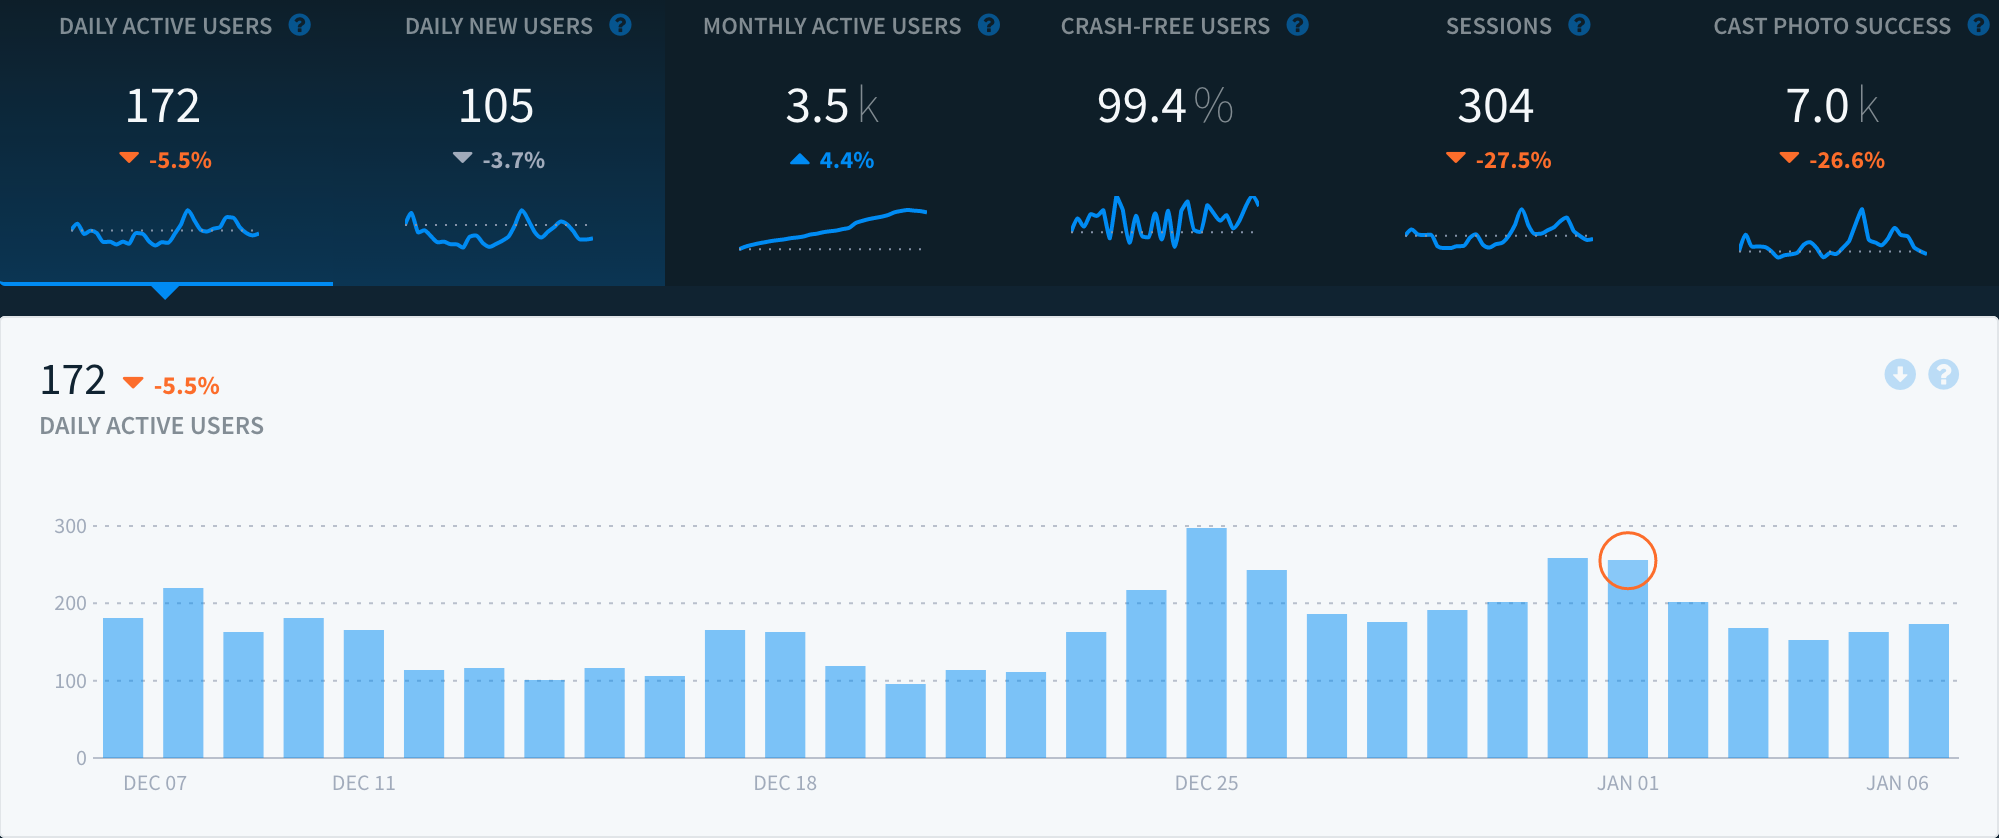
Daily active users have ranged between 100 and 300 during the period.
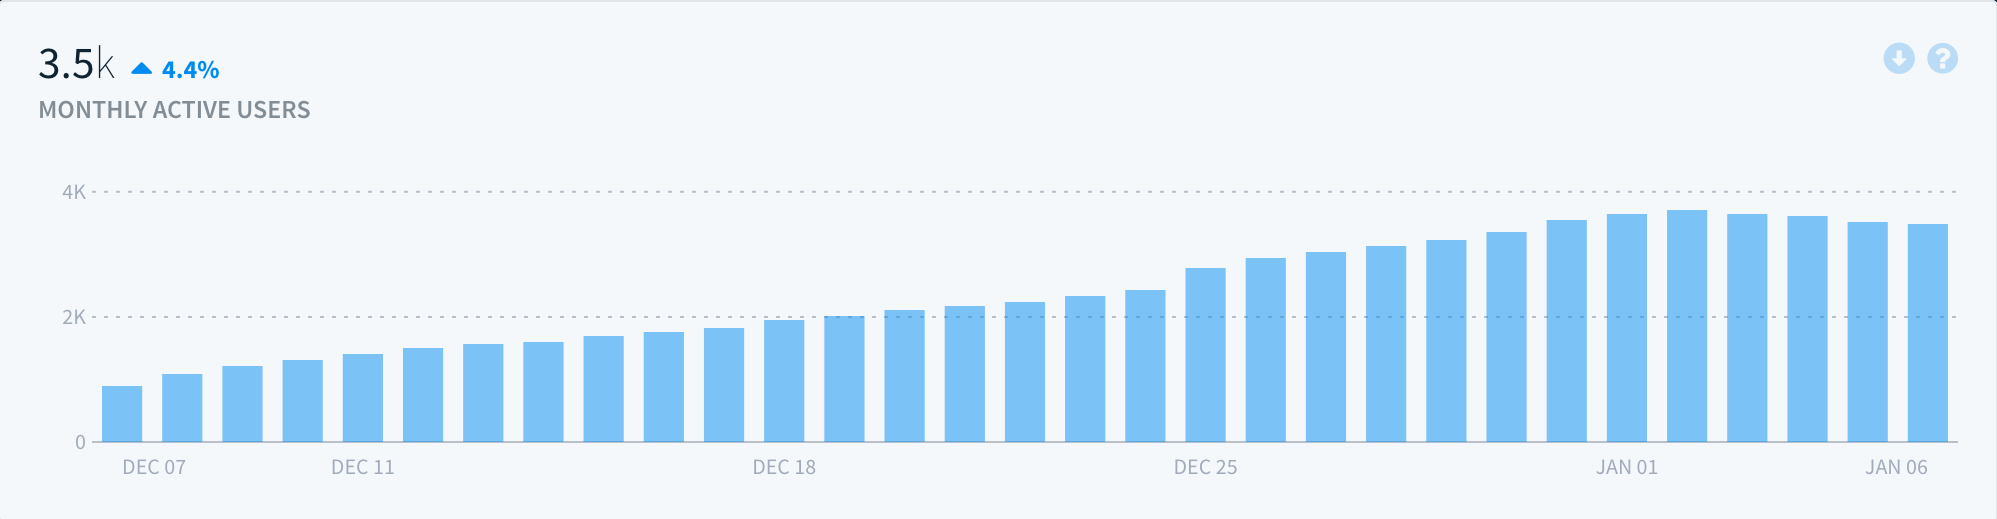
Monthly active users have been ramping up until one month after release, and I see they are now levelling off at ~3.5K.
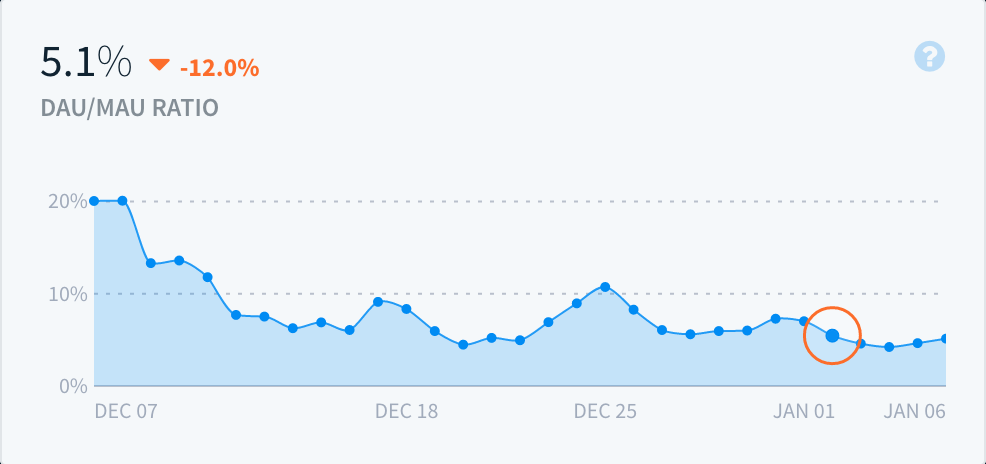
DAU/MAU ratio seems to be stabilising around 5%.
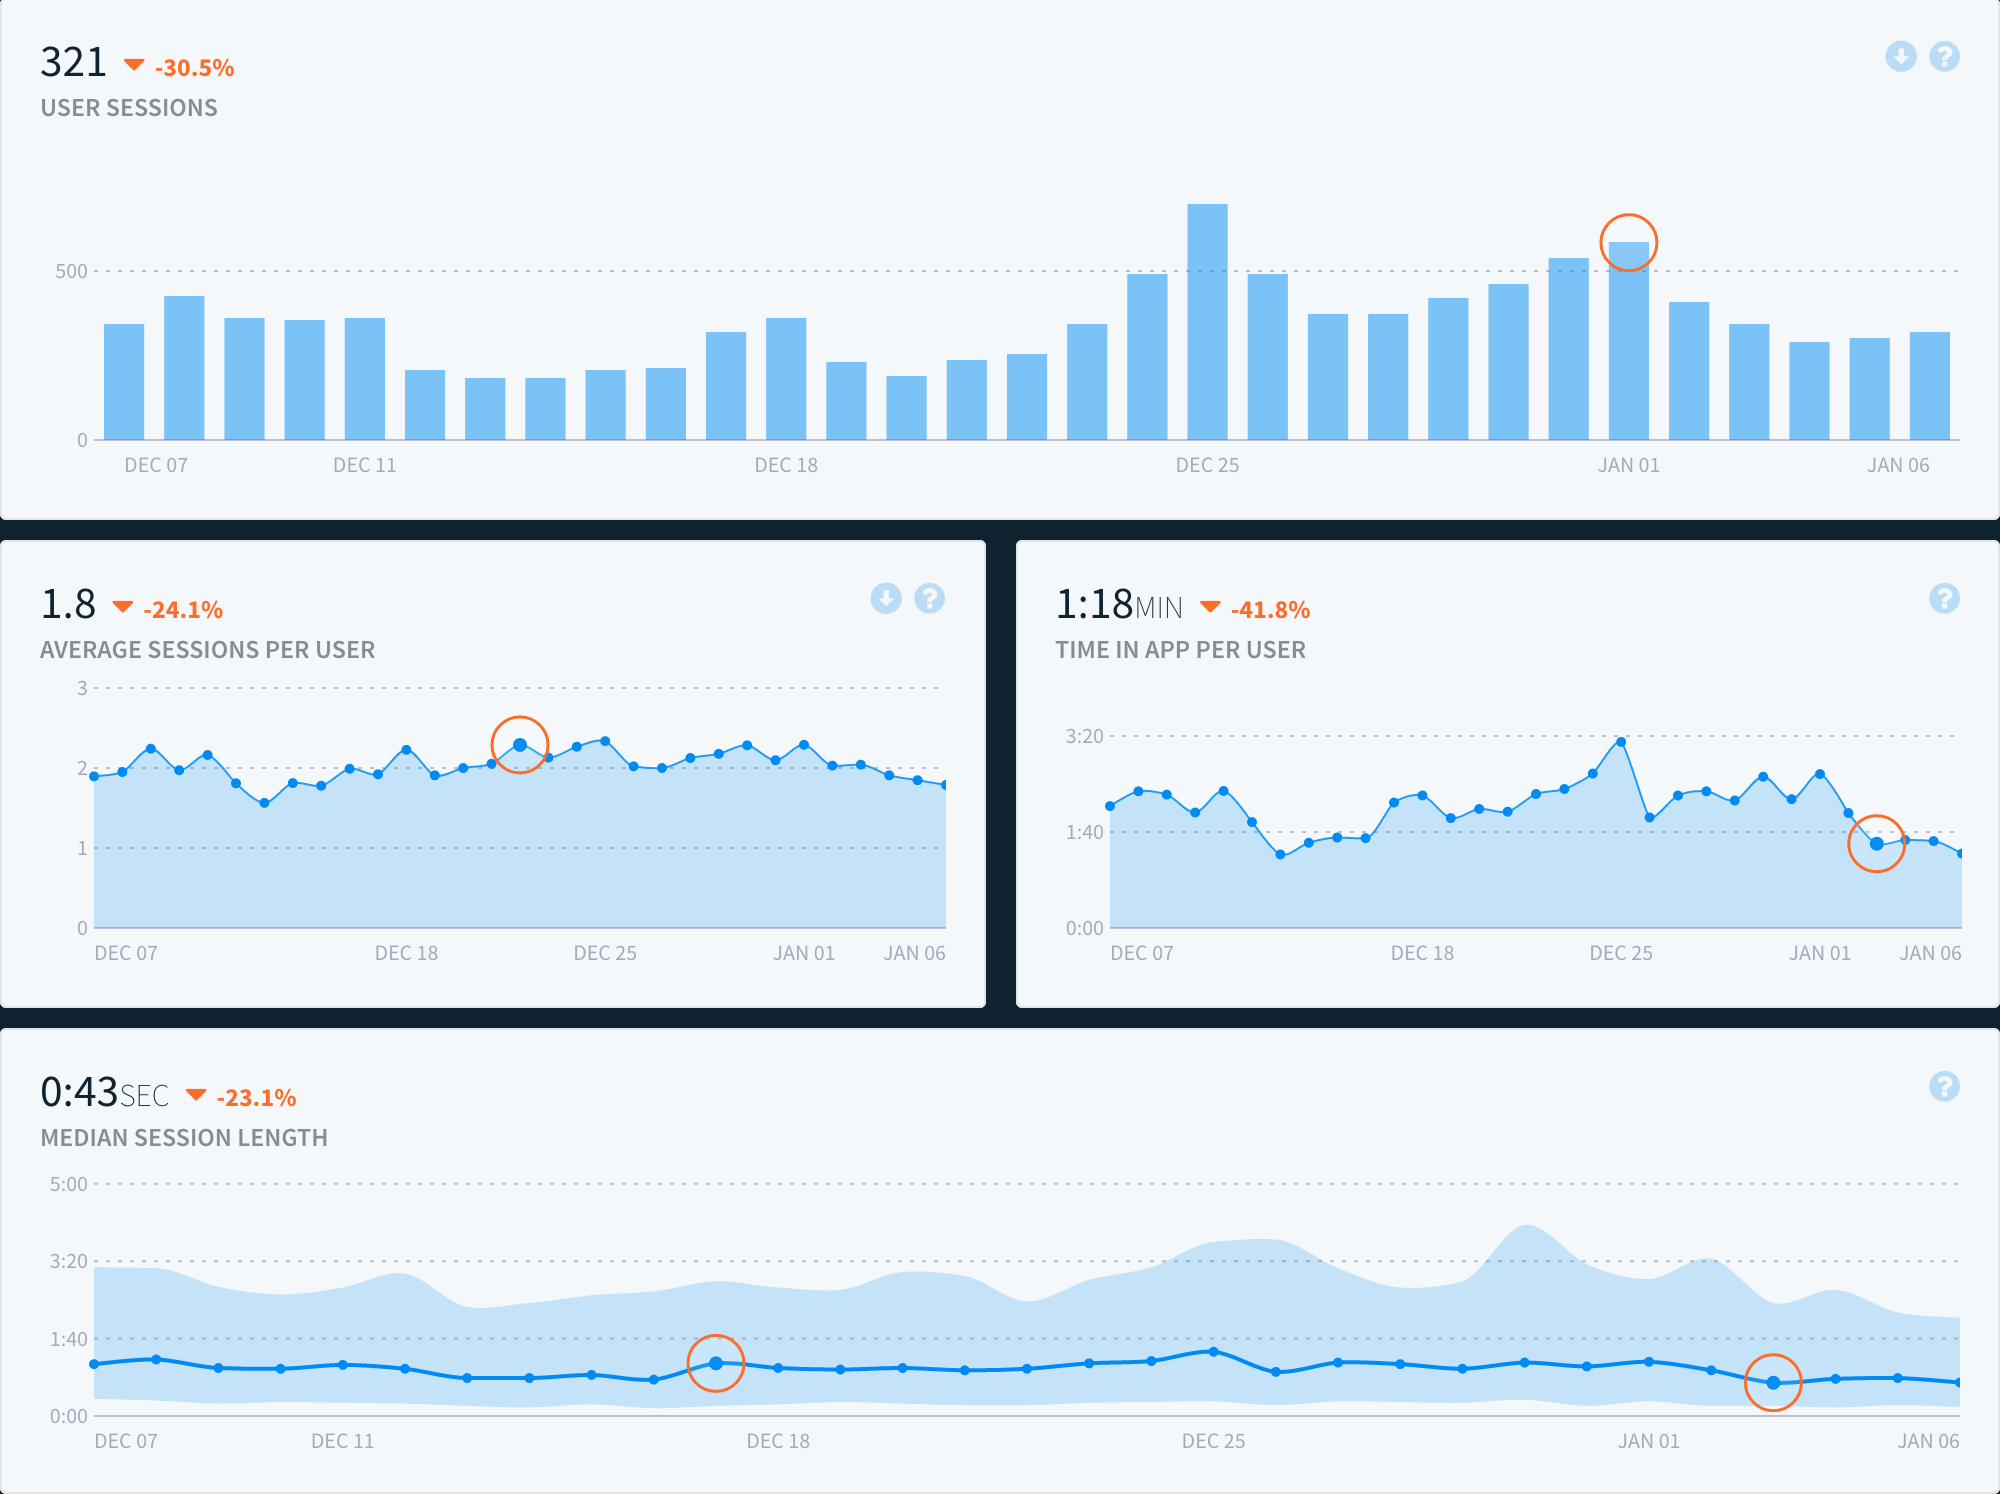
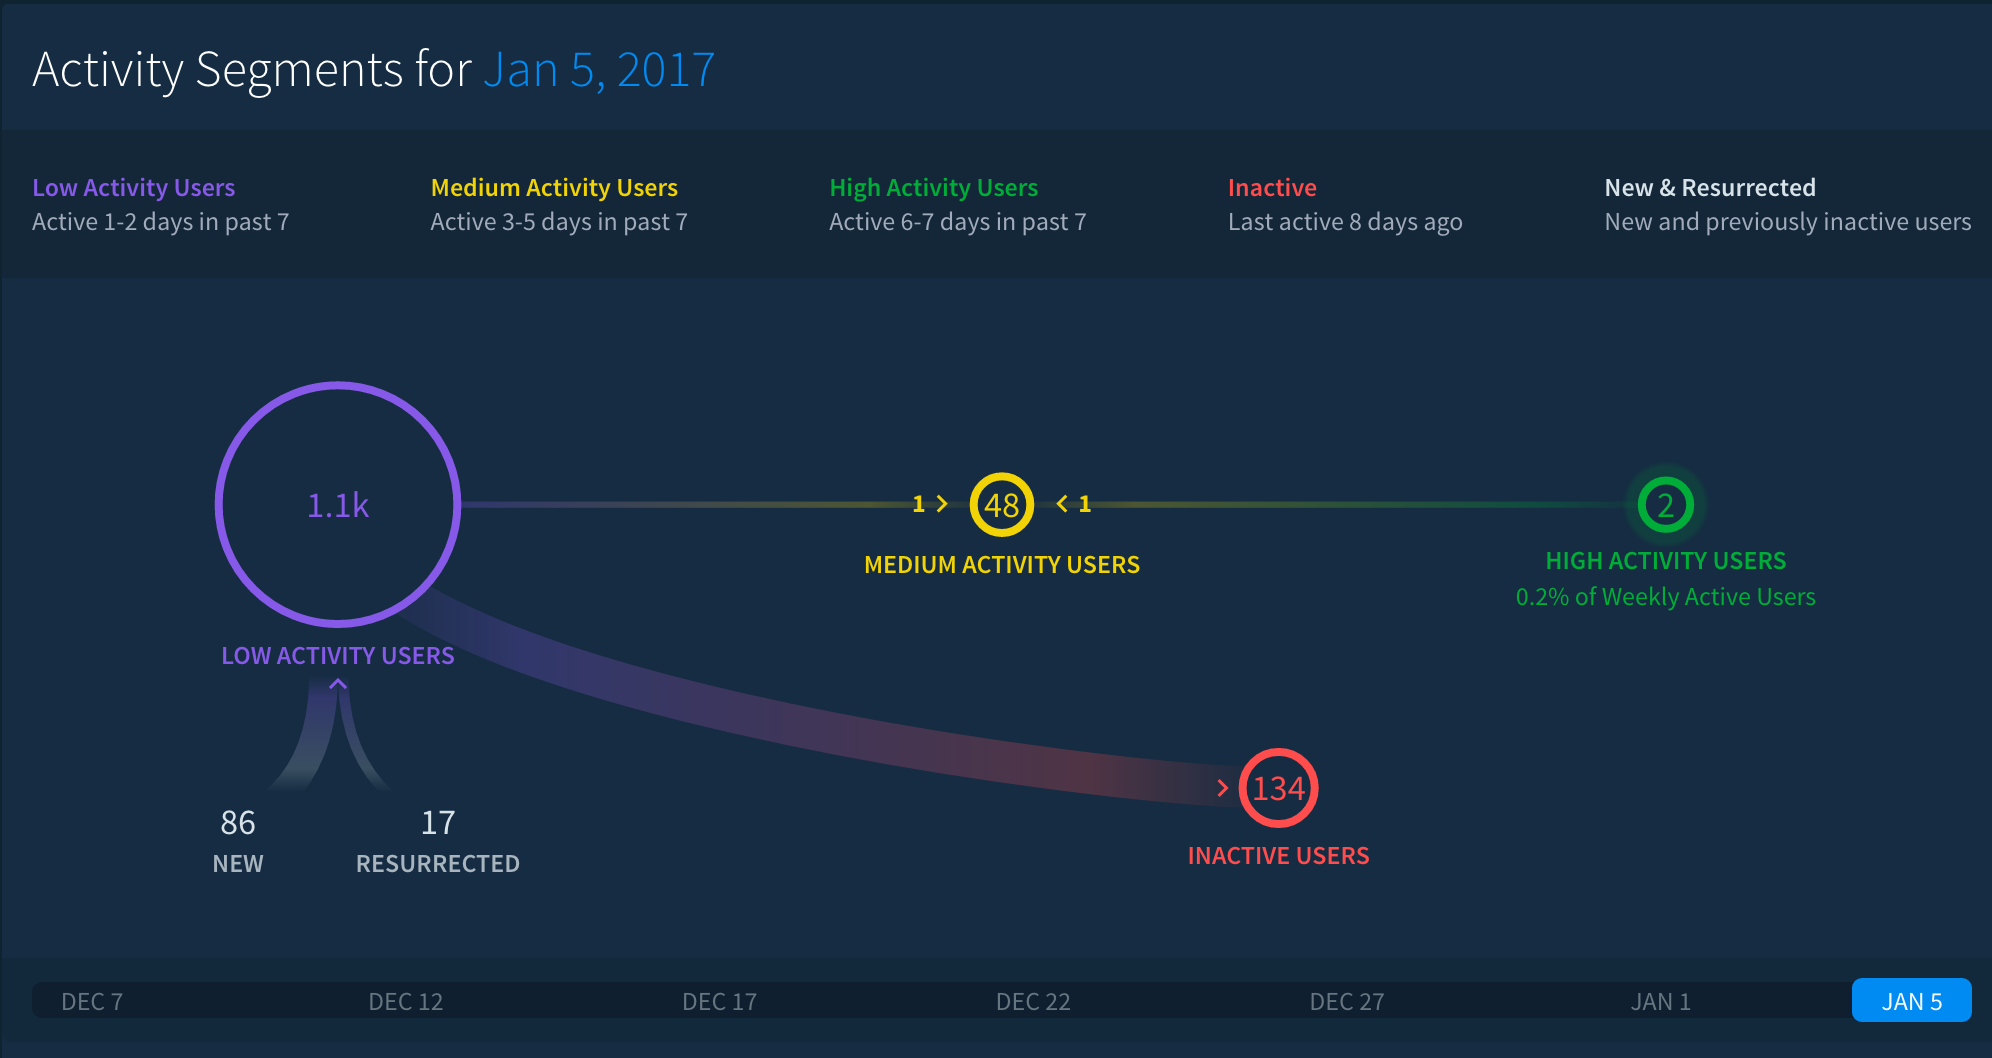
The user session graphs above give me an idea about average engagement, while the activity segments provide a breakdown of low, medium and high activity users. These values have been stable over time.
Key Performance Indicators
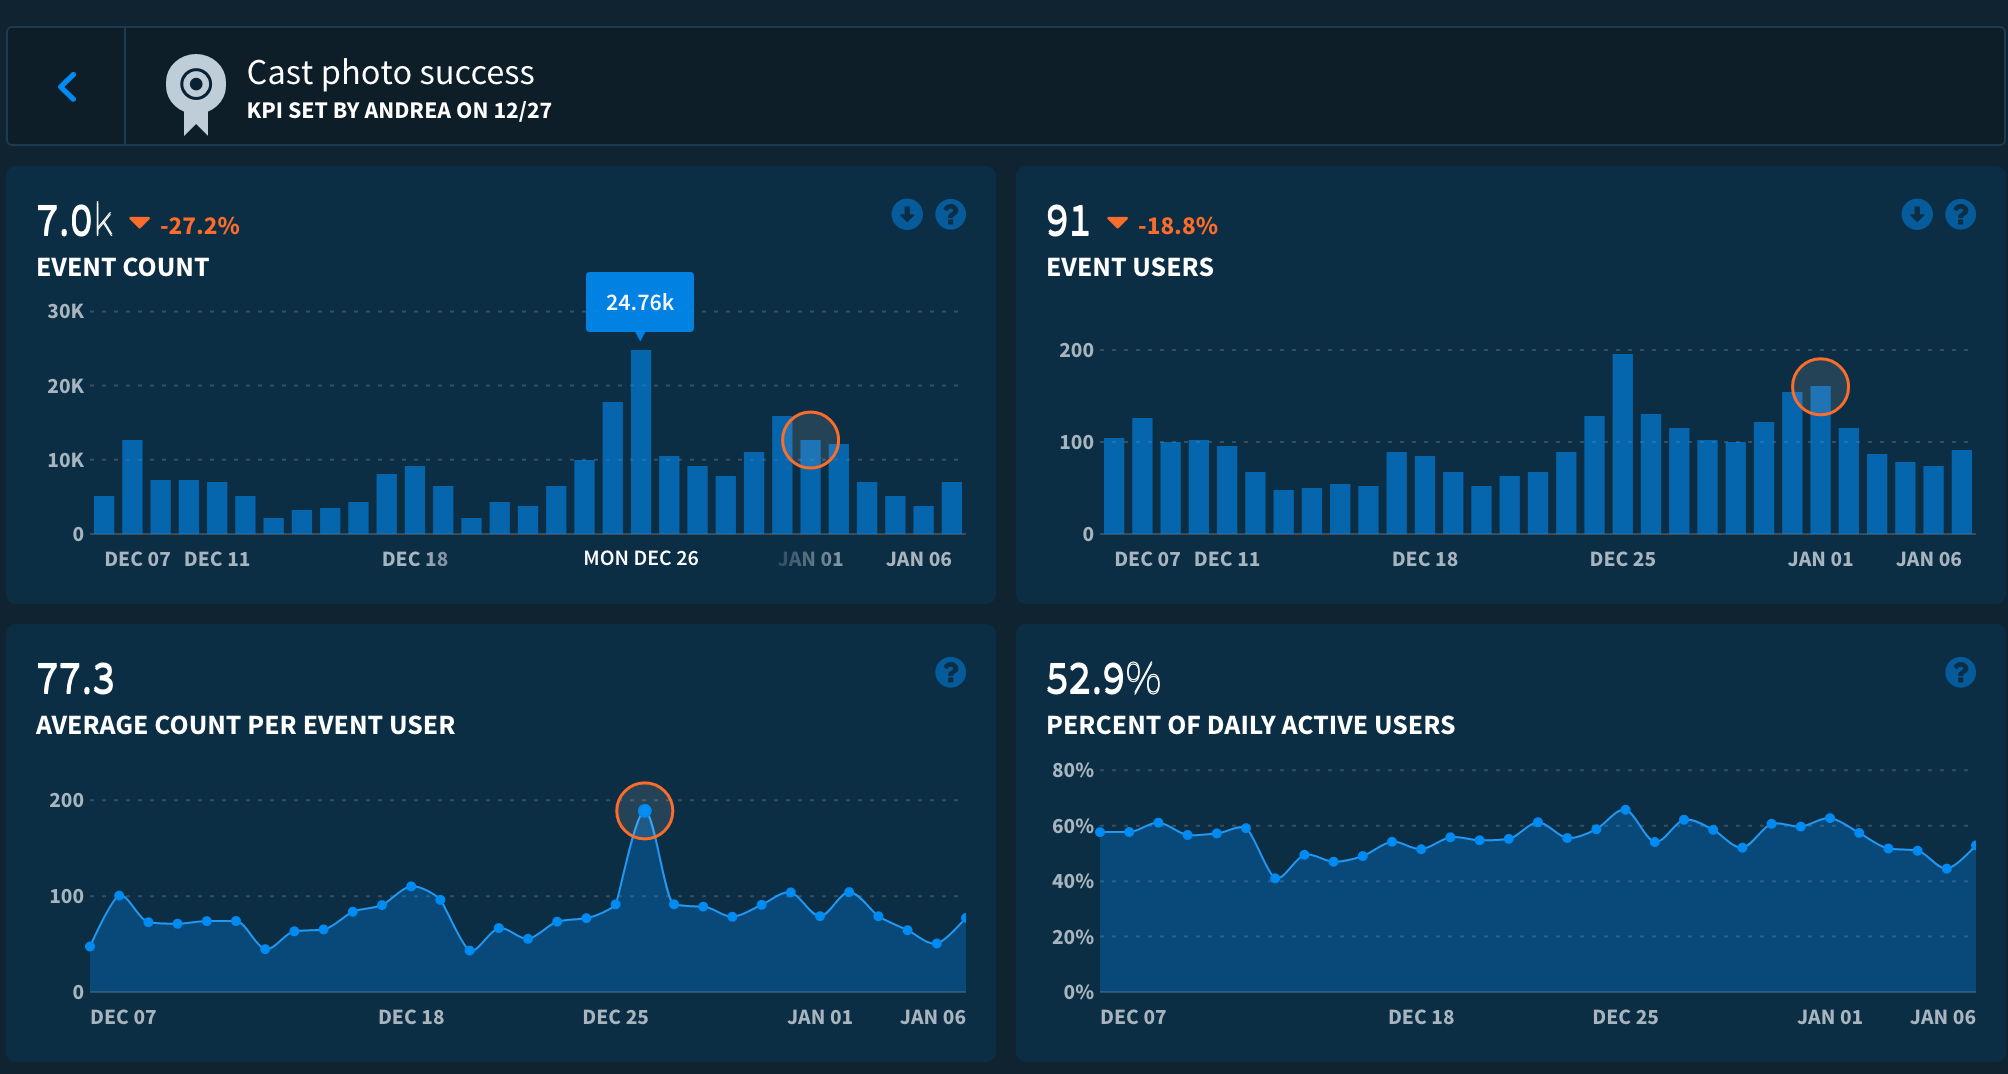
The main action the user can take in the app is casting a photo to Chromecast. I’ve set this as my KPI. This is averaging at ~75 events per user each day.
The peak of events on Christmas and Boxing Day stands out. This may be justified by one of the use cases for this app:
Your family is visiting? Show them the pictures of your little ones on the TV.
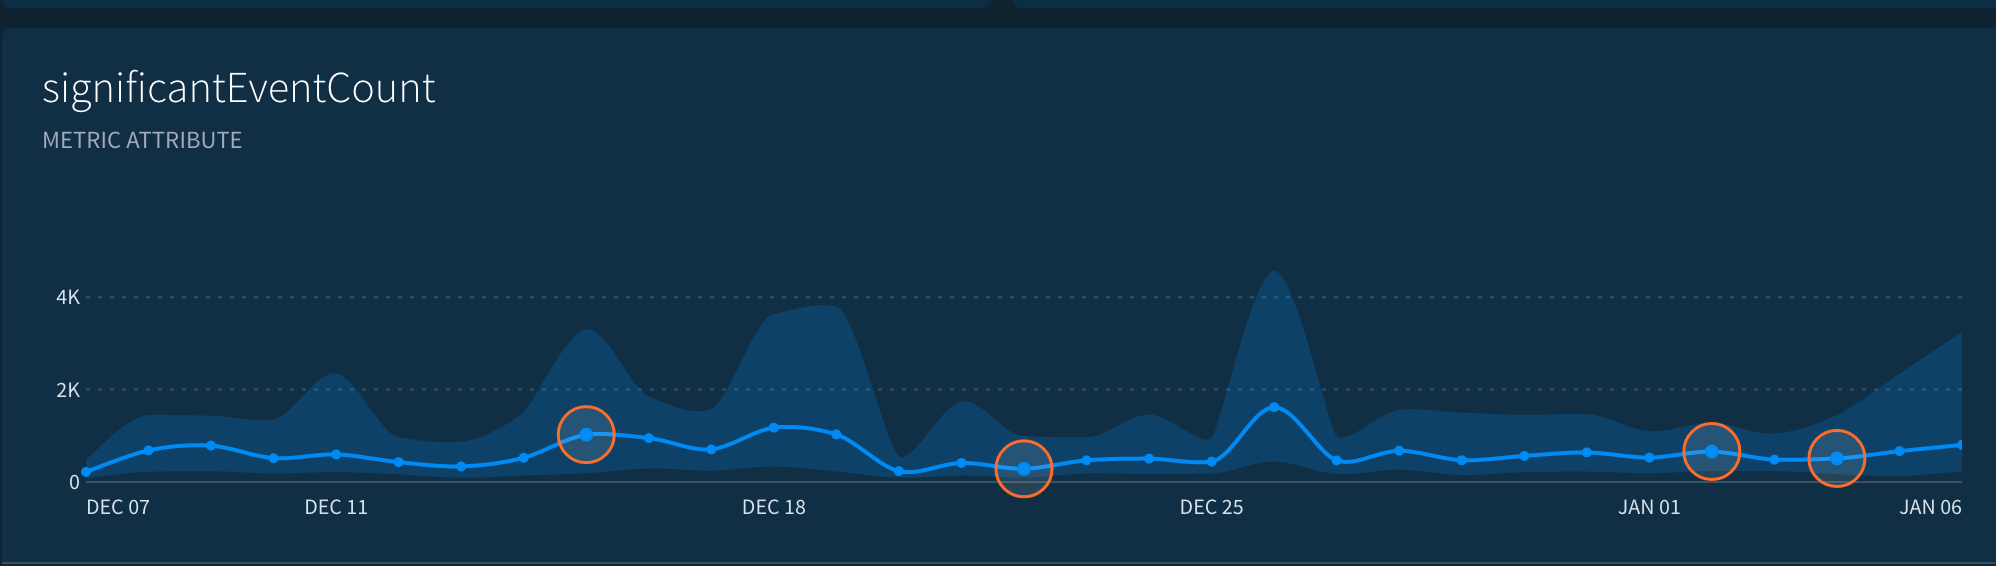
I have linked a metric attribute called significantEventCount, which is calculated as Cast Photo Success * 5. When this value reaches 1000 for a particular user, the following app rating prompt is triggered:
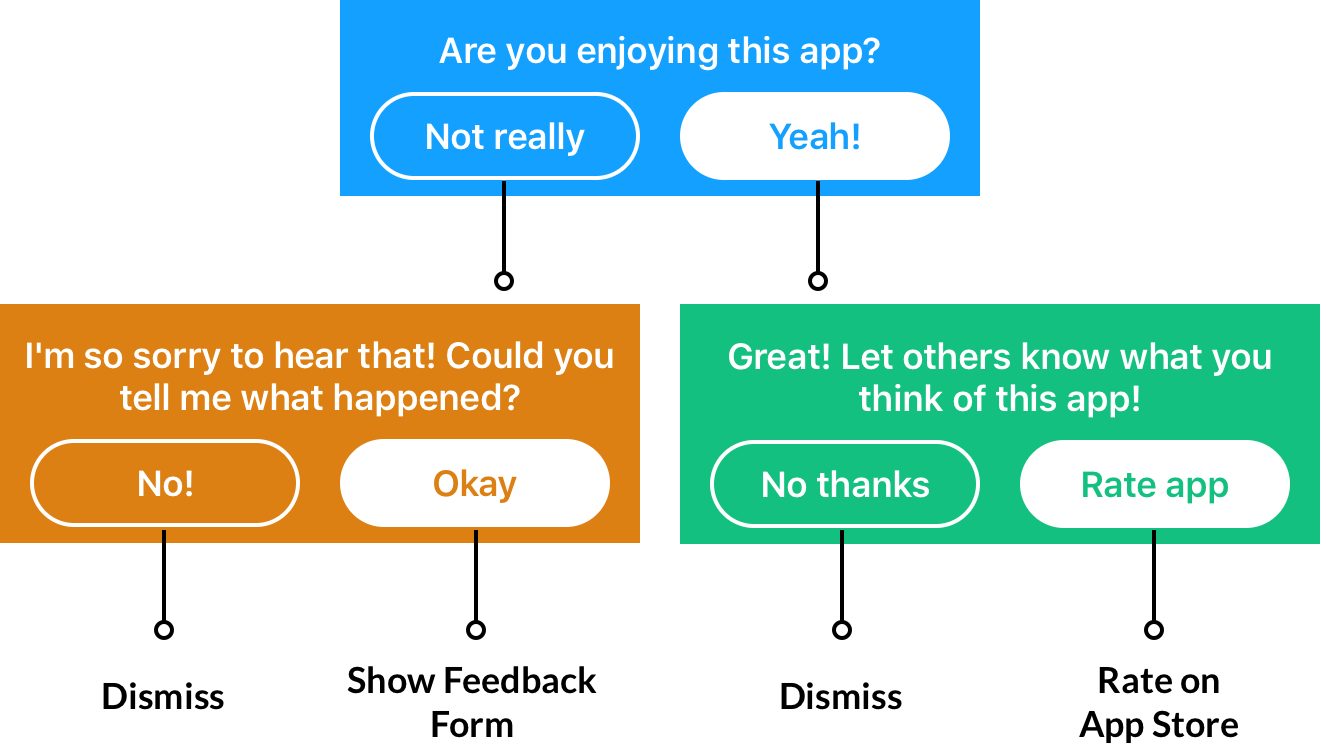
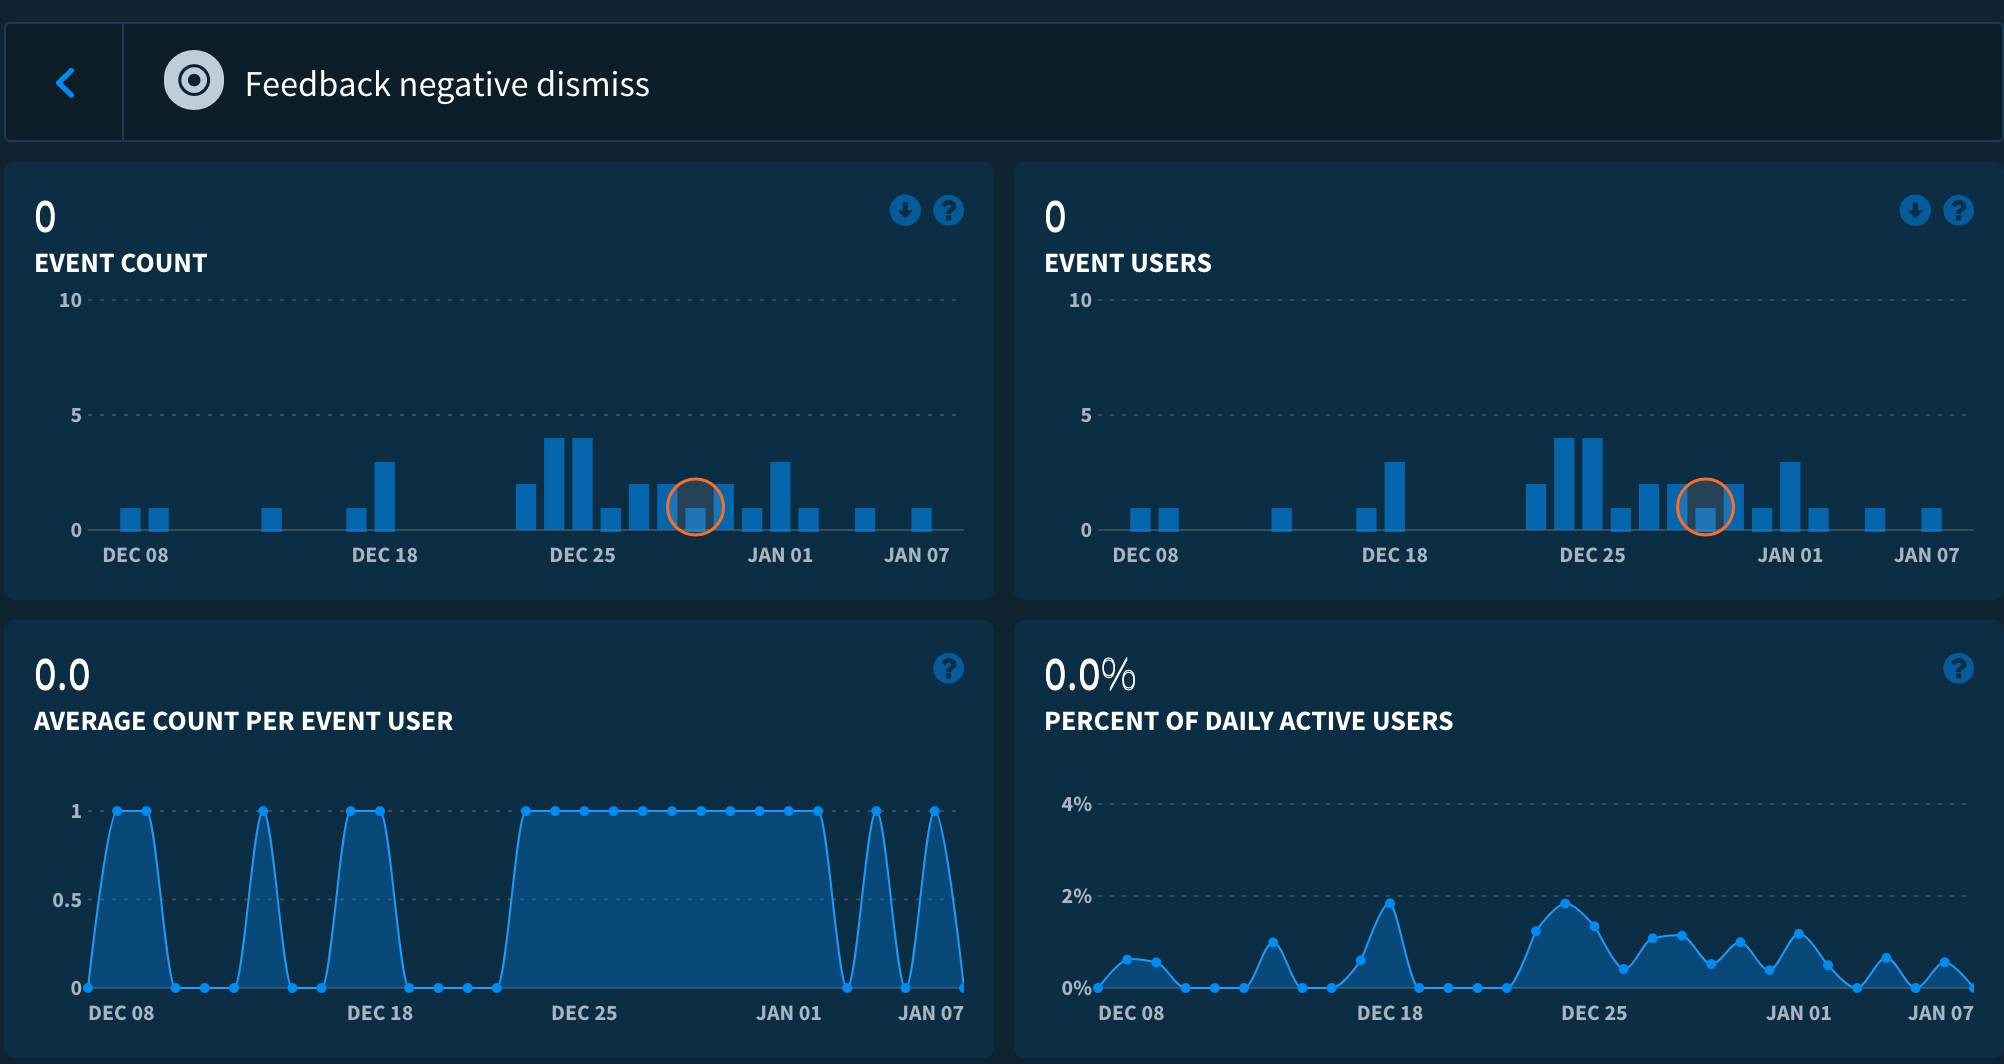
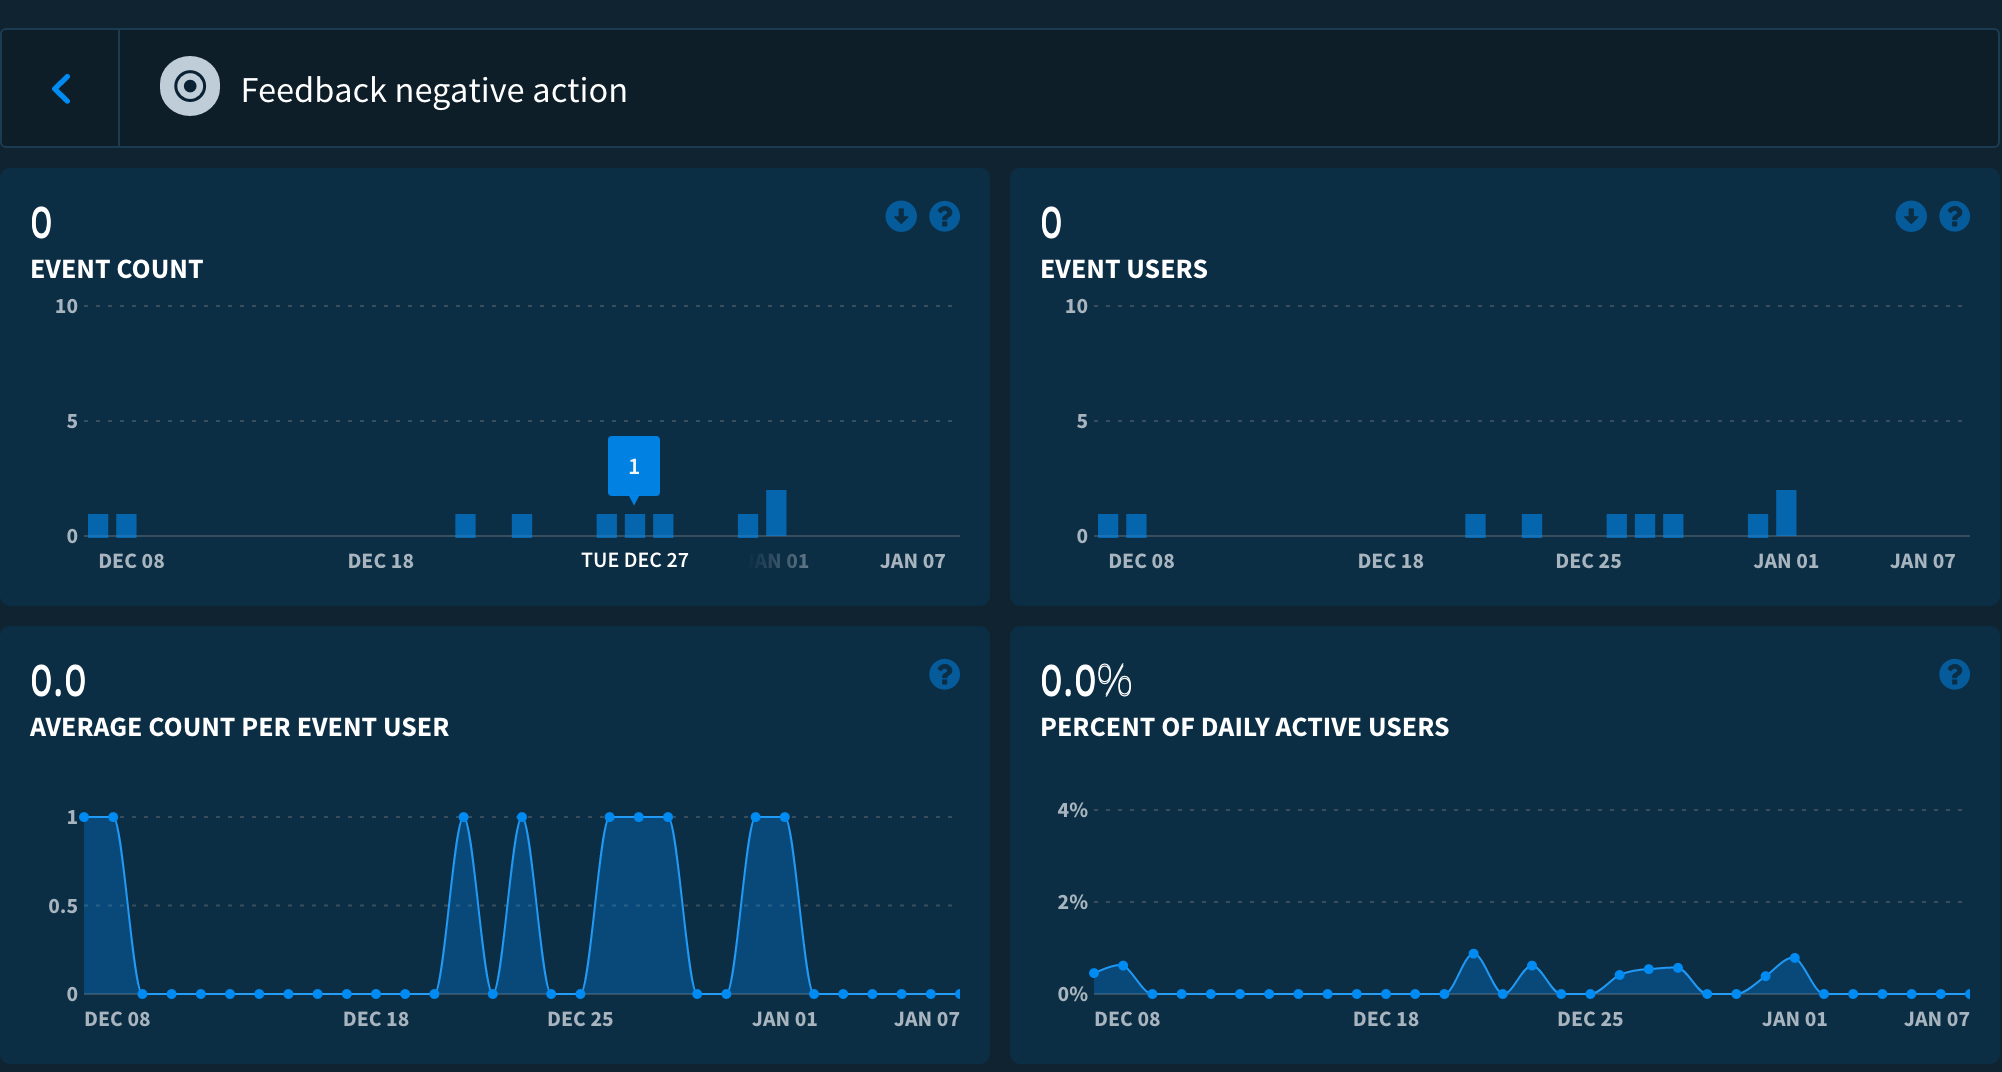
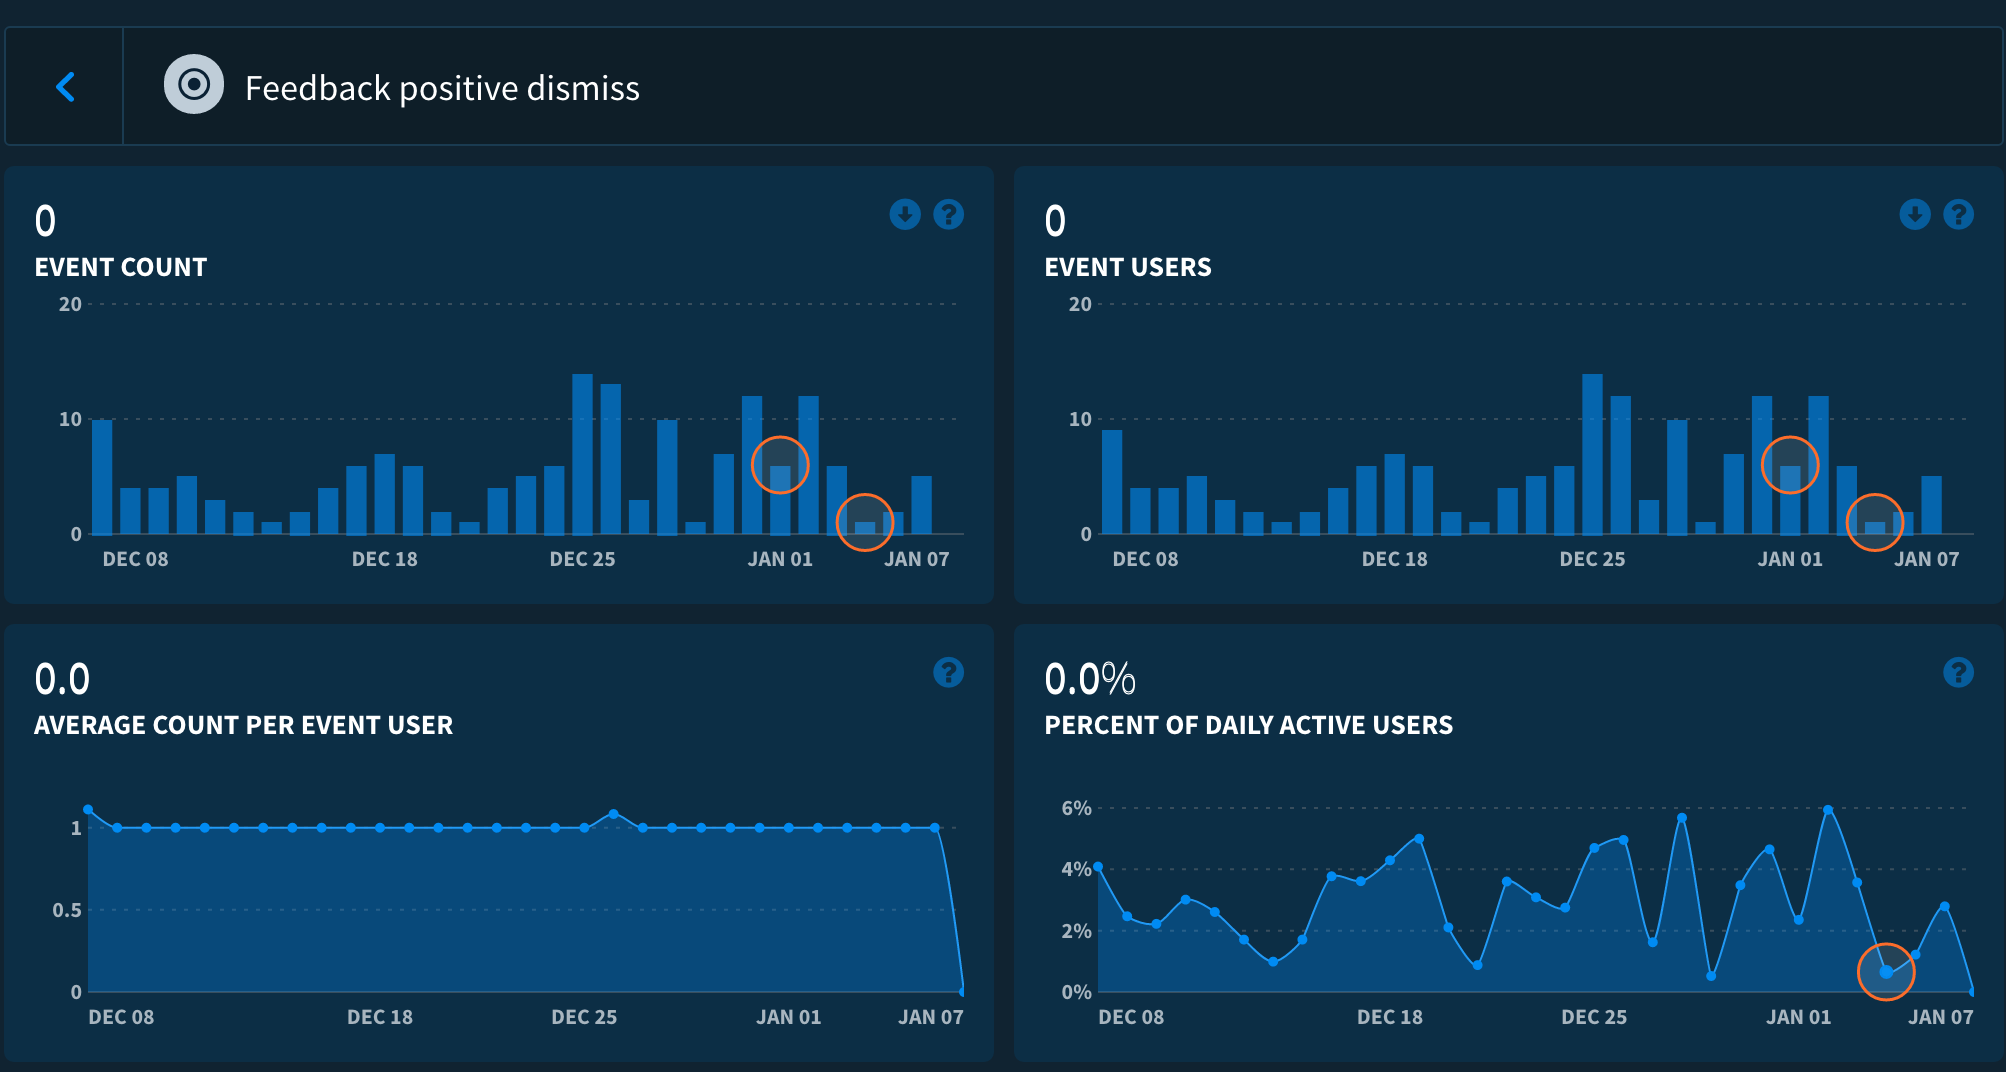
Each exit path is tracked as a separate event, giving me an insight on overall app satisfaction.
NOTE: Going forward, I will track all options as a single event with four segments for easier visualisation:
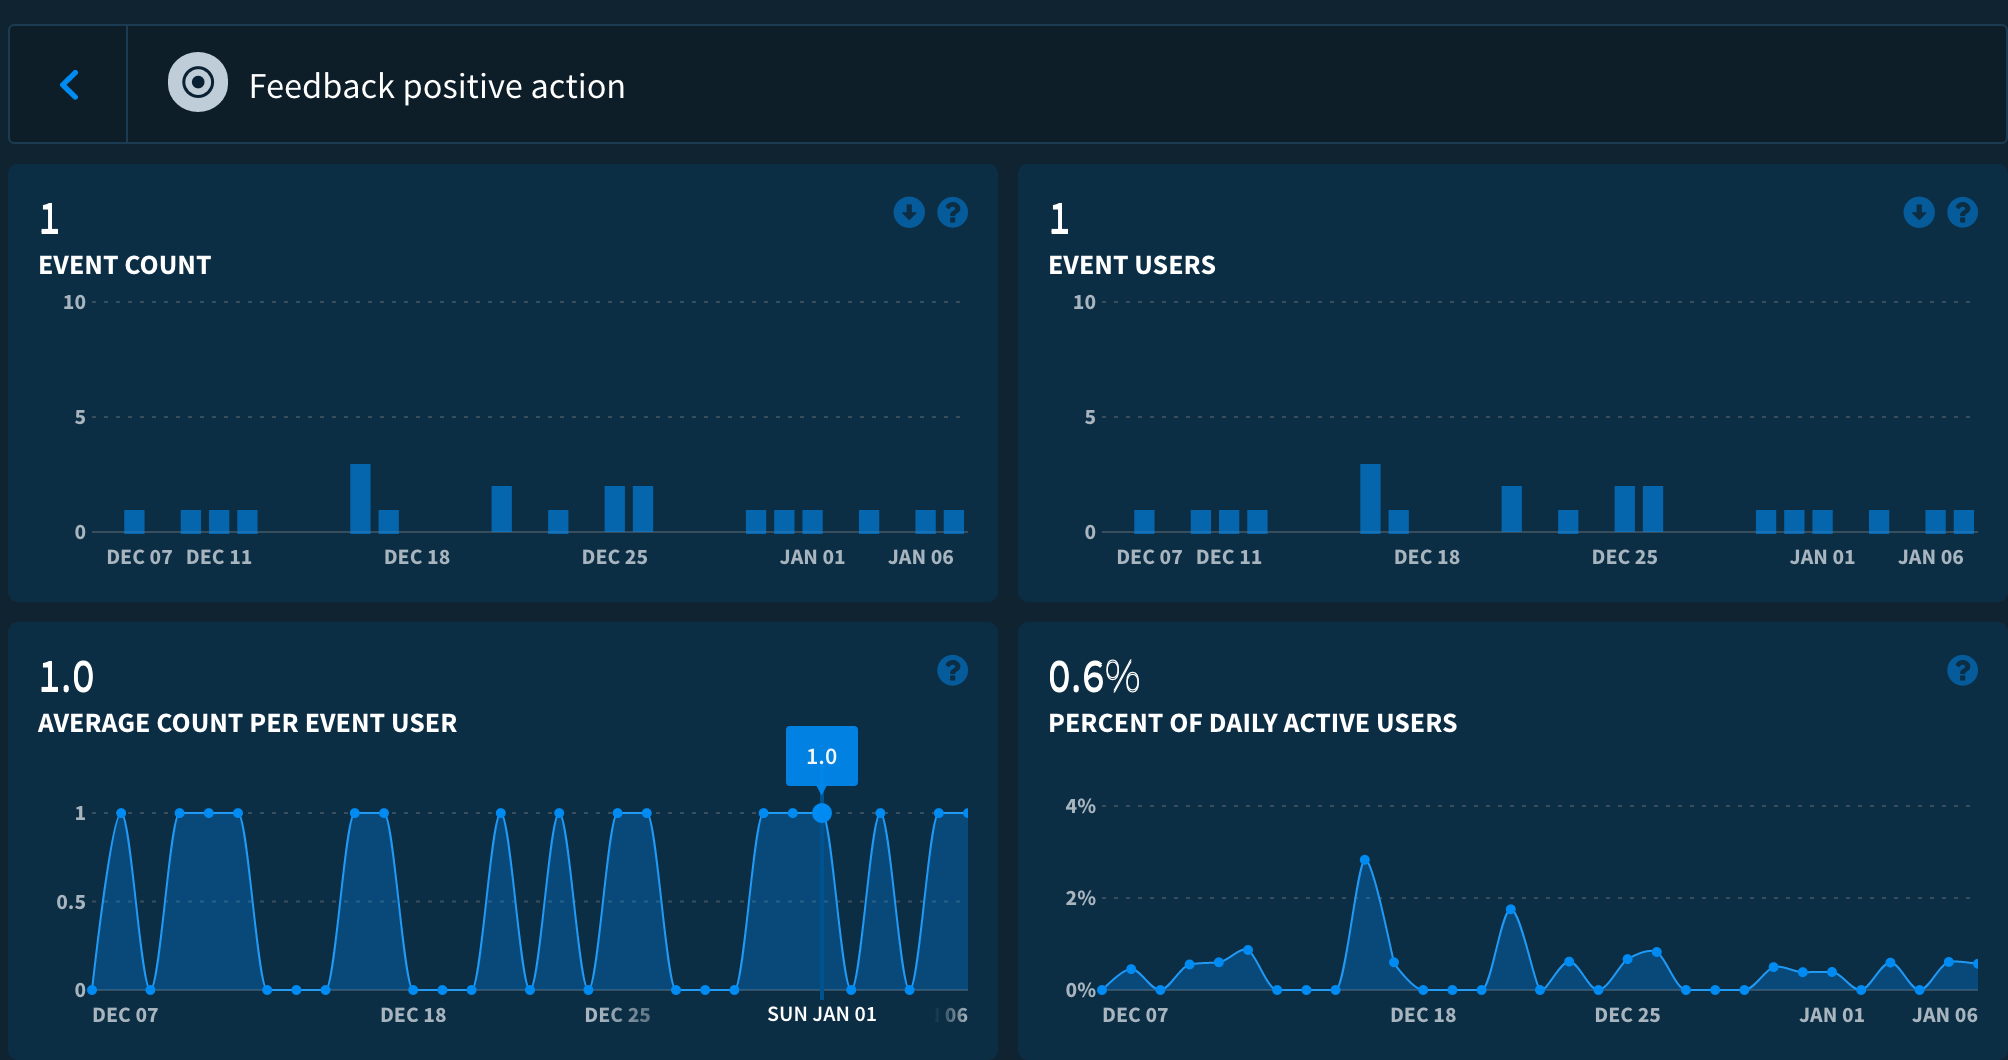
The last graph shows that users have agreed to rate the app approx. 20 times so far. Only 20% of visits to the App Store have converted into an actual review (read below). Indeed, the app review flow on the App Store has a lot of friction.
Retention
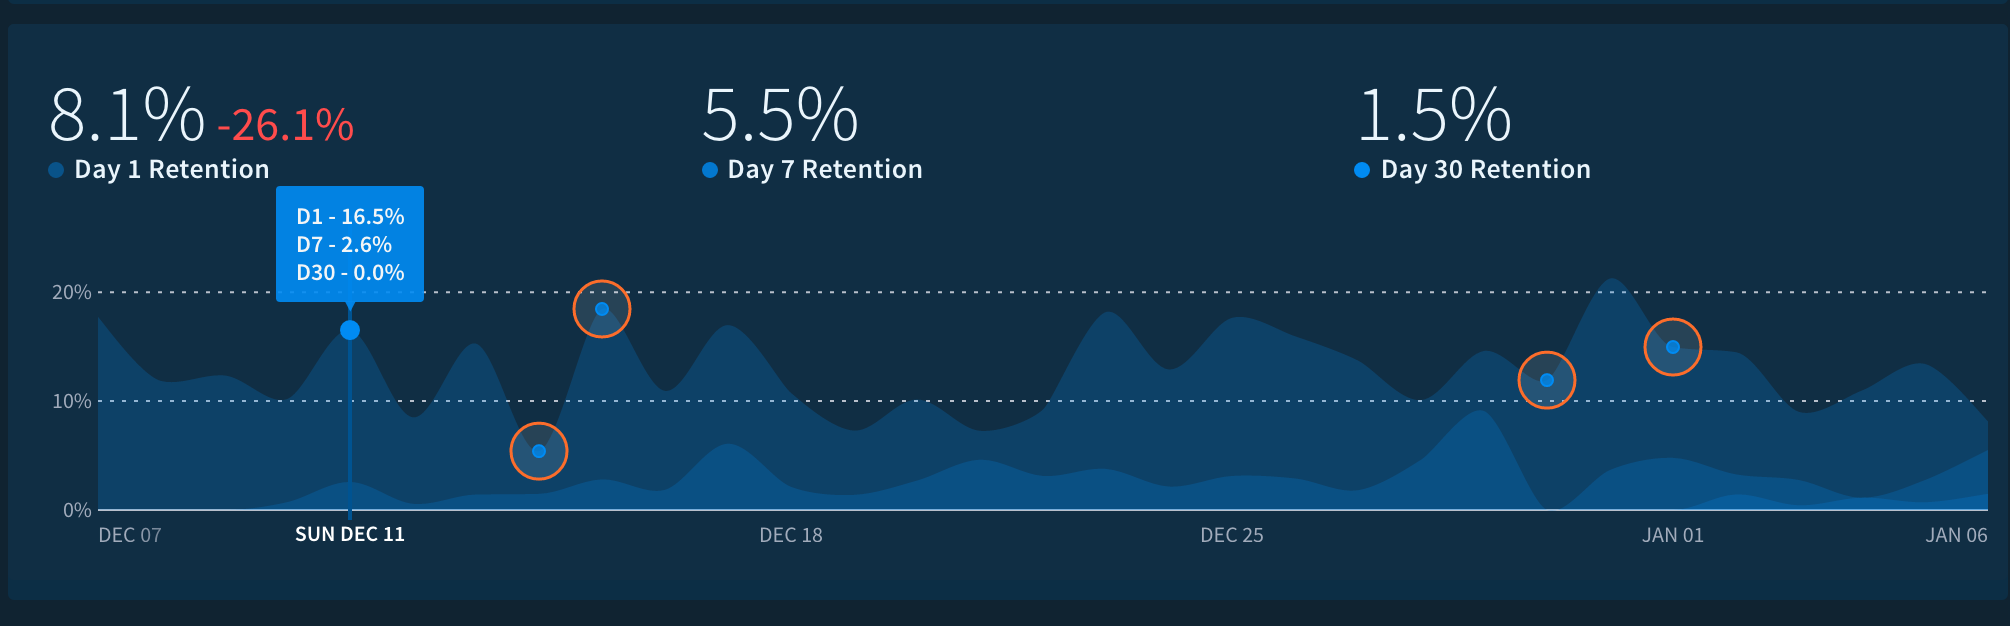
Not great retention figures here — something I should work to improve.
Crashes
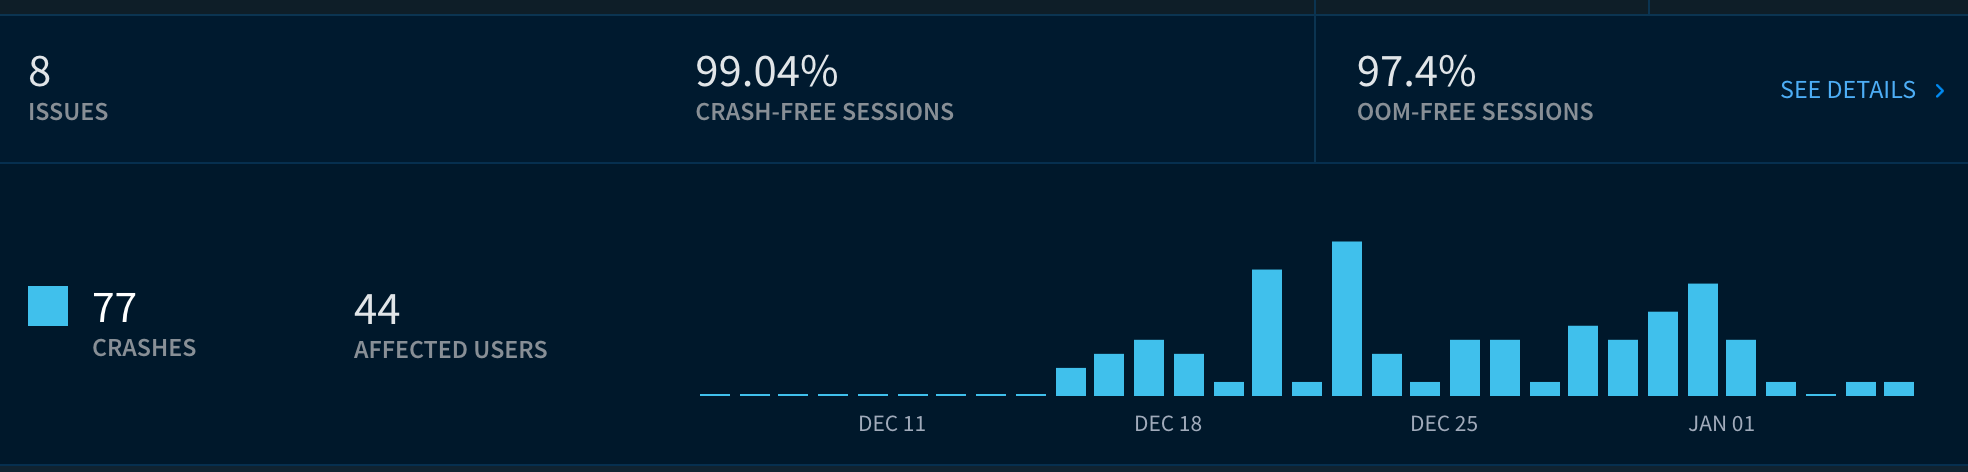
I have spent a good deal of time testing the app before launch, and I’m very happy with the resulting low rate of crashes.
App Downloads & Ratings
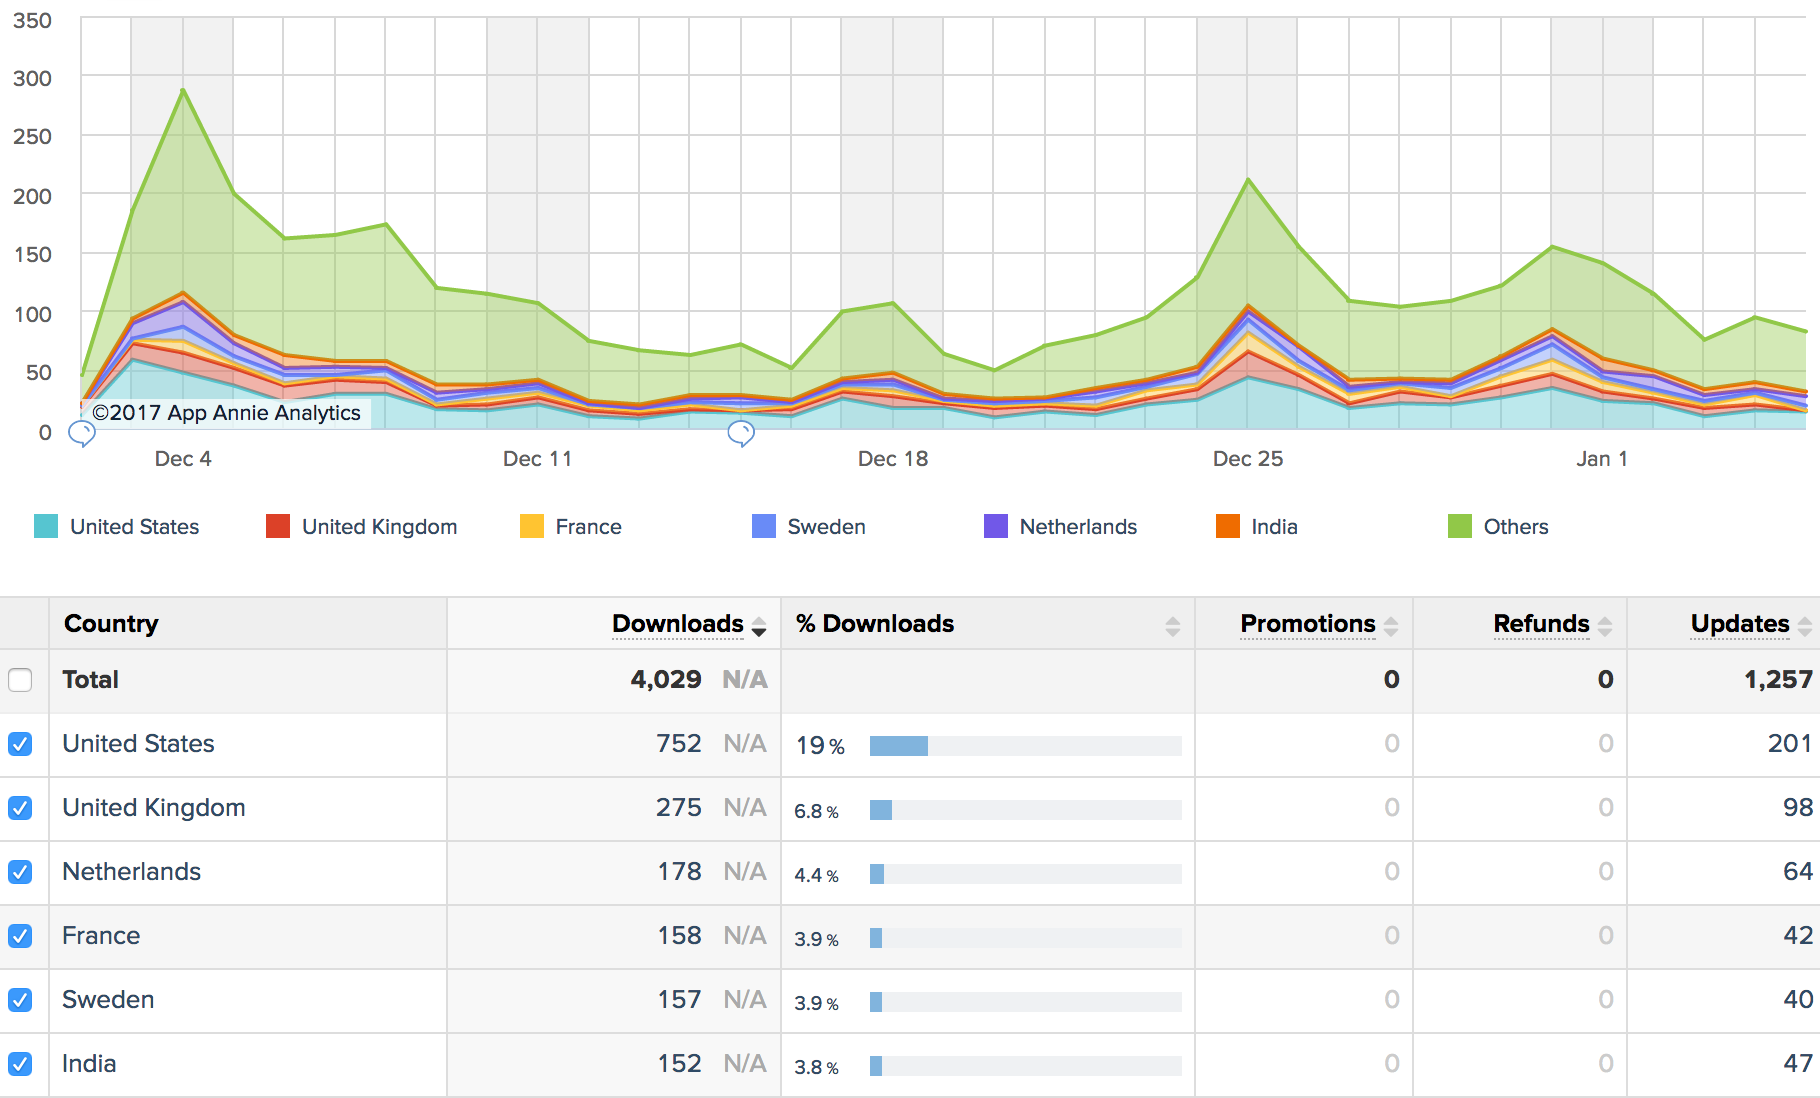
Not much of a splash here. Just a small peak after launch, then mostly settled at ~100 downloads per day.
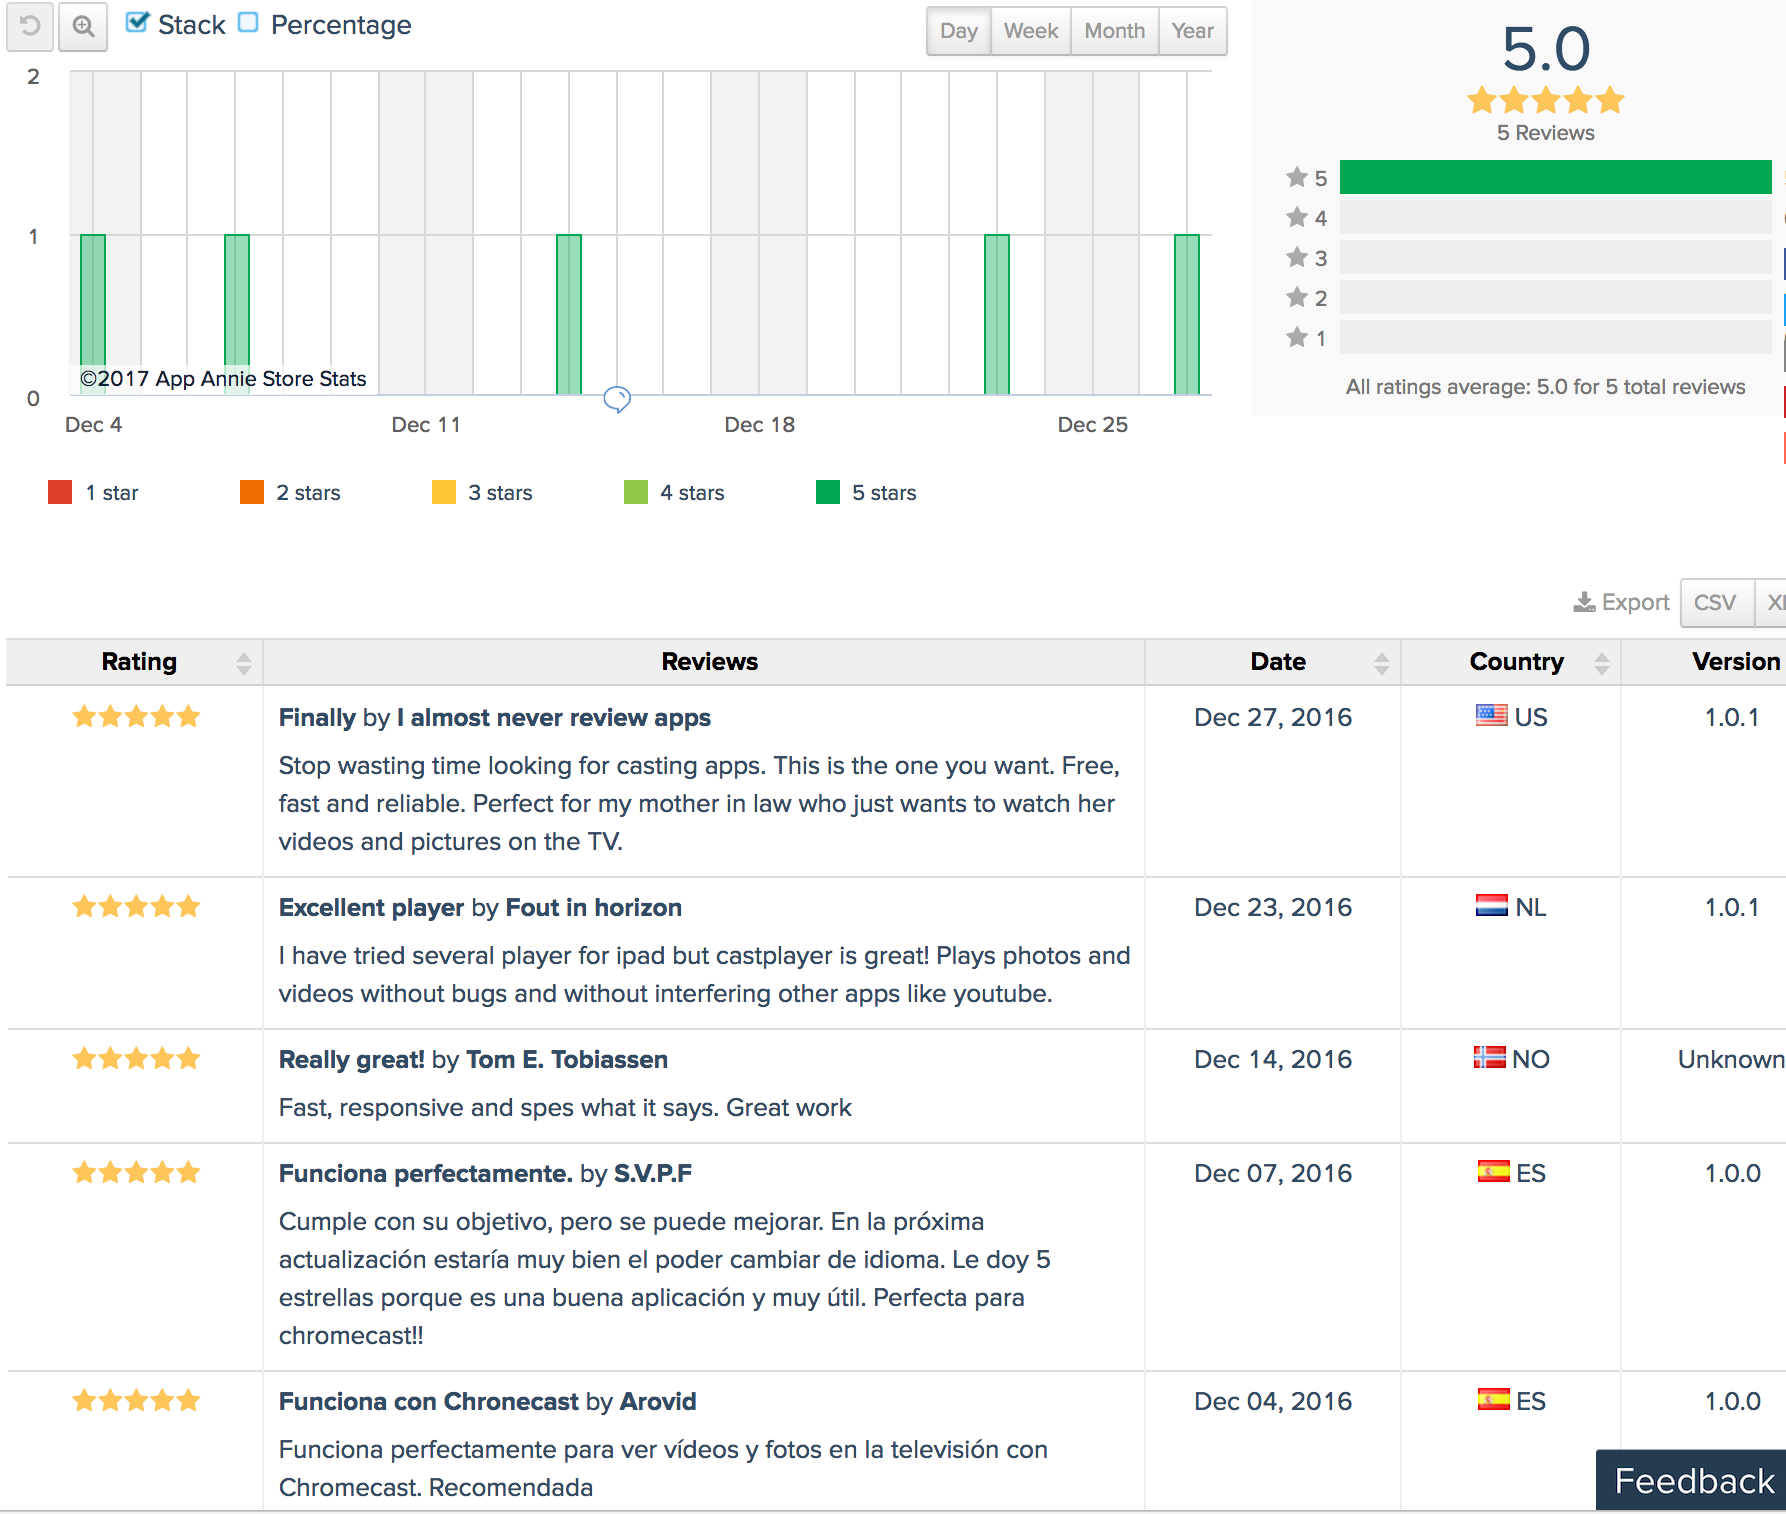
App store reviews have been overwhelmingly positive so far. I may try to tweak my app rating prompt logic to get more ratings on the back of my main KPI (see above).
Keywords & ASO
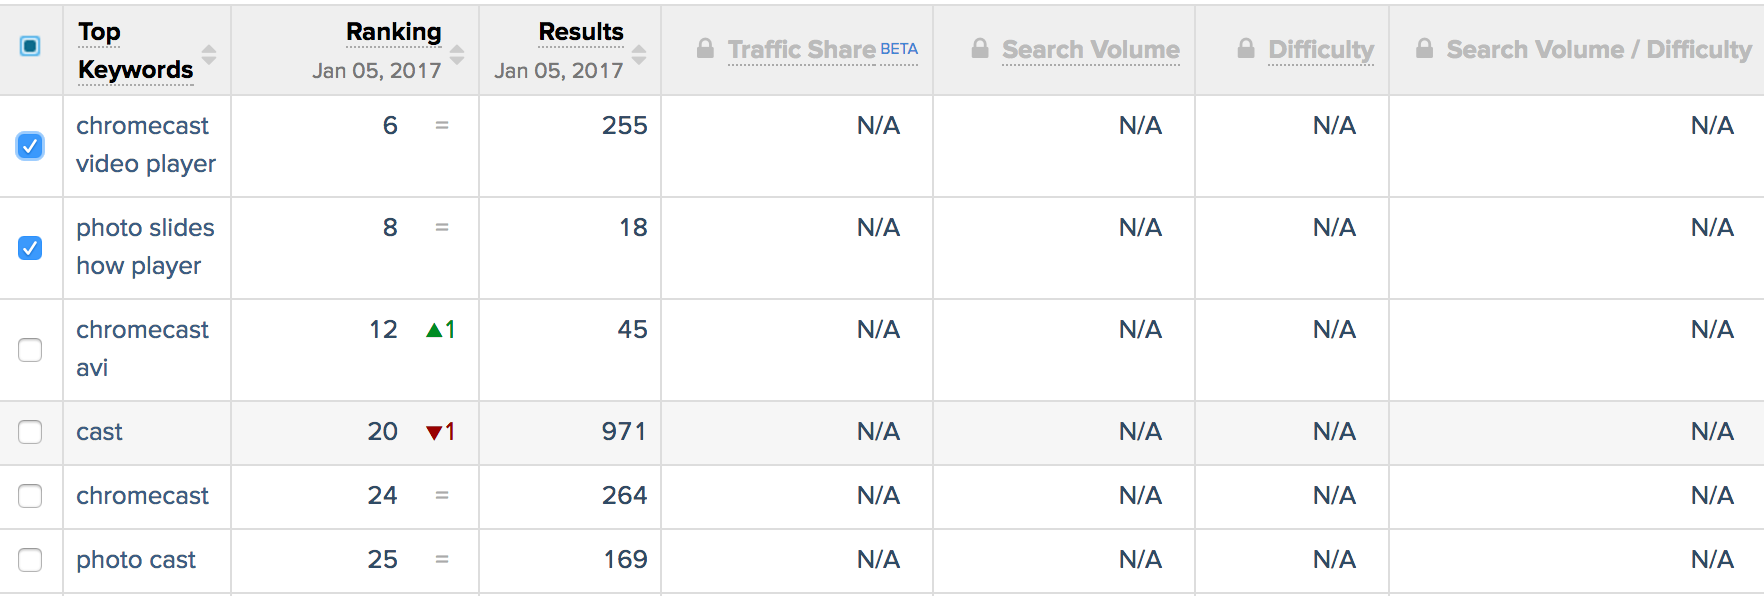
As expected, there is a lot of competition on keywords.
While AppAnnie claims that the keyword Chromecast ranks on position #17 in the UK, it appears to show up in 4th place when I search for it directly.
Given my lack of marketing, the vast majority of my app downloads derive organic search. I should tweak my keywords and improve the landing page to increase downloads.
Conclusion
Instrument your apps with analytics to get valuable insight about discovery, user engagement and retention.
Fabric is a great tool for this. It is more intuitive than the other app analytics products out there — you should use it too!
It has a top-notch dashboard and uses progressive disclosure, making it easy to learn and gradually understand the various features. Some of my favourites:
- See the median, 25th and 75th percentiles for line charts.
- Non-fatal errors reporting, which is very useful to track unexpected conditions in the app.
That’s it for today! 😀
Read next: My Side Project of the Year: Building an iOS App.
If you liked this post, you can share it with your followers or follow me on Twitter!